-
Introduction to PPP in the infrastructure sector
-
Chapter 2: Structuring a PPP project
-
Chapter 3: Financing an infrastructure PPP project
-
Chapter 4 :Documenting the transaction: anatomy of a PPP concession agreement and key risk allocation issues
-
Chapter 5: Documenting the transaction: finance documents
-
Chapter 6:Documenting the transaction: other project documents
-
Chapter 7:Procurement arrangements
-
Chapter 8:Introduction to key sector issues
The growth of PPP from an historical perspective
PPP investment has shown a steady growth in many countries worldwide; the graph below shows an example from low and middle income countries where growth was steady until about 2011. The combined effect of falls in the price of oil and other natural resources, as well as the knock-on effects of the credit crunch (loss of liquidity) brought on by the global financial crisis may have slowed progress somewhat.
In the UK, about 750 PPP projects were signed over this period, and many other developed countries adopted a similar model and also have impressive tallies of projects. Some countries, such as the US, have come later to the game as different financing structures such as municipal bonds have been an option instead of external financing. Nevertheless, it is clear that in the US market a large infrastructure deficit exists, so PPP is increasingly being seen as an answer to increase the pace of delivery.

The diagram below illustrates the growth of private investment in Africa specifically. These
figures from 2015 show where the majority of private investment has been directed in the
region, and it is not surprising to see that telecoms had the highest investment given the rapid
expansion of mobile telephony in Africa and a rapid growth of telecom towers and undersea
cables provided by private initiatives.
PPP is still a relatively small component when it comes to private investments in infrastructure in
Africa as is demonstrated in the diagram below:
(a) Energy infrastructure forms the next highest level of investment. This can be seen
as a form of PPP, in so far as the government promotes private investment by
guaranteeing an offtake of generated power.
(b) Outside of energy, ports represent the next-largest investment sector – this is
perhaps not surprising given the increasing desire for manufactured goods and
container traffic as economies improve and increasing middle class populations
drive demand.
(c) However, the number of financially closed projects in the non-energy infrastructure
space remains low. One recent World Bank study from 2017 concluded that only
14 PPP projects had reached financial close in the preceding five years in Africa
with a total investment of $8bn. Another study put the success rate of projects in
Africa – from publication of concept to financial close – at a mere 8%.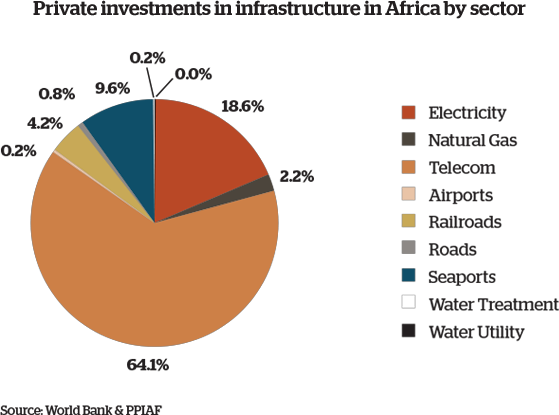
| SUMMARY OF KEY POINTS |
| Sectors where PPP is used
· Fixed-infrastructure projects with a long lifespan form the majority of PPP projects because the project requirements are easier to define, the concessionaire has greater control over how these requirements are met, and therefore it is easier to allocate risk between the parties. · The PPP model has been applied to some novel sectors, but the newer the sector, the more bespoke the contract and the harder it is to allocate risk without a good precedent to follow. Growth of PPP projects · As can be seen in the graph at section 1.4, PPP has shown a steady growth until 2011 when the combined effect of falls in the price of oil and other natural resources, as well as the knock-on effects of the credit crunch (loss of liquidity) brought on by the global financial crisis slowed progress. · The pie chart at section 1.4 illustrates how private investment in infrastructure in Africa has grown. Telecoms had the largest amount of investment, PPP had a relatively small amount of investment but this included energy infrastructure projects where the government often promotes private investment by guaranteeing an offtake of generated power and ports, which is not unsurprising given the more frequent container traffic, the growth of economies globally and the increasing desire for manufactured goods. |